Introduction
“What is the ideal heart rate for my training sessions?” It is a classical question, yet many answers continue to circulate. Apart from the fact that a lot of variation between workouts is mandatory and monotony should be avoided, the cornerstone of endurance training is the development of the aerobic system, especially the combustion of fatty acids. Trainers usually refer to this capability as ‘basic endurance’ (BE), as well as the above question, asked by athletes.BE is mainly trained by means of moderate intensive continuous training, which perfectly can be monitored by heart rate (HR). Eighty percent of maximal HR (HRmax) is easy to calculate and therefore often used as the upper limit for BE training. However, many recreational athletes, predominantly runners, complain that this HR value is too low to stay in the ‘target zone’. On the other hand, well-trained endurance athletes argue that their HR at the aerobic threshold (LT1) is much higher and they therefore reason that they have to train more intensively to optimize fat oxidation. In addition, the debate continues regarding the best anchor point to delineate training zones: it is argued that the use of fixed percentages of HRmax does not sufficiently reflect underlying metabolism (Iannetta et al 2020). Using LT1 or LT2 as an anchor point, allowing to account for training status, therefore might have a theoretical advantage over guidelines based on HRmax.
The aim of the present study is to compare some of the circulating HR guidelines with each other and between subjects of different training status, to test the hypothesis that 80% of HRmax is a valid, or at least reasonable measure to train BE.
Methods
The data of 173 consecutive exercise tests, performed in a private practice since January, 1st 2018, were analyzed. The majority of the clients (82,1%) were men. Age averaged 43 years (range: 14 to 69). Nearly three-fourth of the tests (74,0%) were conducted on the bicycle, either on a standardized and calibrated bicycle ergometer, or with the own bike mounted on a Tacx Neo.Each subject was tested with a protocol consisting of three-minute stages. Depending on the weight and presumed training status of the subject, warming-up of the bicycle tests occurred at either 60 or 100 Watt, followed by increments of 40 Watt. For women, a protocol of 50 + 25 Watt per 3 minutes was adopted, i.e. a warming-up at lower intensity followed by smaller steps.. In case of running, the initial speed was either set at 6,5 or 8,0 kph, but always augmented with 1,5 kph. During all tests, conducted by the same experienced supervisor, clients were instructed and encouraged to exercise until voluntary exhaustion.
HR and lactate concentration were recorded during the last 30 seconds of each stage and immediately after cessation of the exercise test. Maximal power or speed was expressed relative to the duration at the last stage: eg., ending the test after 1’30” at 220 Watt corresponds with a maximal power of 200 Watt.
Capillary blood samples were taken from the earlobe (cycling) or the finger (running) to determine lactate concentration by means of the devices Lactate Pro 2 (Arkray). Since the lactate values, as they appear on the screen of the device, reflect hemolyzed values (Aries N, Arkray, e-mail, 07/11/2016; Goodwin at al 2007), and therefore are ‘falsely high’, they were converted to non-hemolyzed values using a conversion table developed in the laboratory (Hespel P, KU Leuven, e-mail, 06/18/2015). These converted lactate values were subsequently used to determine the aerobic (LT1) and the anaerobic threshold (LT2) by means of the ReMBLa method. The rationale, methodology and preliminary research regarding its clinical utility has been published elsewhere (Pardaens 2020). In short, the ReMBLa method determines LT1 and LT2 ‘Relative to Maximal Blood Lactate’, using fixed percentages of maximal lactate value. Compared to established methods, the ReMBLa method corresponds better with the subjects’ short- and long-term training background as well as reported endurance performances.
The power or speed at the threshold was expressed as a percentage of respectively maximal power or speed. Consistent use of these three-minute protocols over the past 14 years revealed that percentages for LT1 typically range between 50 (untrained) and 80% (very well endurance trained), with the highest percentages noted during treadmill testing; for LT2, percentages range between 70 and 90%. For example, when the power at LT1 amounts to 55% of maximal power, this points to a rather untrained state. Conversely, a speed at LT2 amounting to 88% of maximal speed little or no room for progress remains.
Two-sided unpaired Student’s T-tests, assuming unequal variance, were used to compare subgroups according to gender, type of test and training status. Paired T-tests were used to compare HR values within groups. Statistical analysis was performed with Microsoft Excel. P-values smaller than 0.05 are considered significant.
Results
Table 1. Exercise test data.

Abbreviations & legend to the table: HR, heart rate; LT, lactate threshold; NS, not significant;
*P < 0.05, **P < 0.01, *** P < 0.001, ****P < 0.0001; values are presented as mean (bold) and SD (small, italic).

Abbreviations & legend to the table: HR, heart rate; LT, lactate threshold; NS, not significant;
*P < 0.05, **P < 0.01, *** P < 0.001, ****P < 0.0001; values are presented as mean (bold) and SD (small, italic).
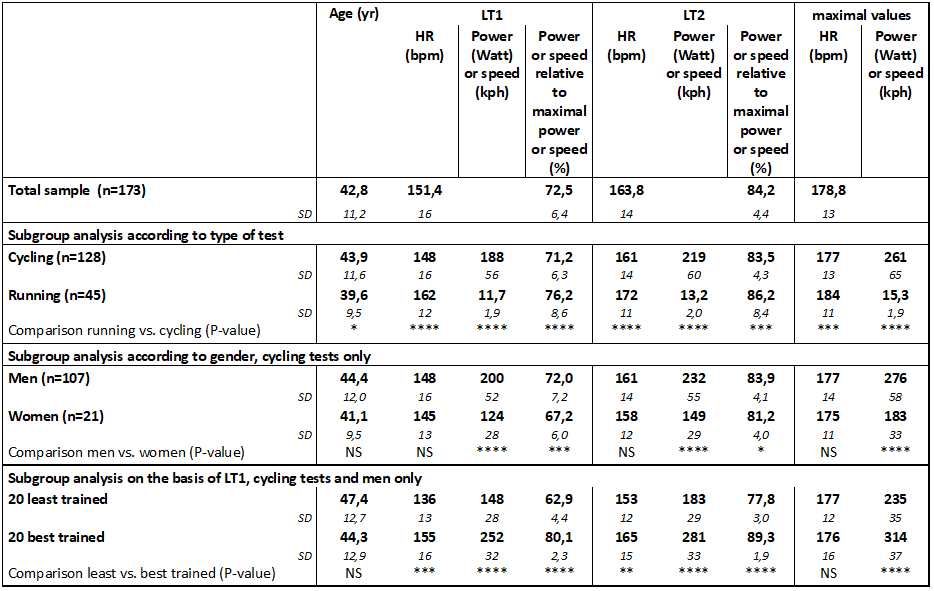
Table 1 shows the test data of the whole sample and for subgroup analyses.
HRmax collectively averaged 179 bpm, perfectly in line with the rule of thumb predicting a decline of 220 minus age. LT1 and LT2 amounted, respectively, to 73 and 84% of maximal power or speed, suggesting a relatively well-trained clientele.
Comparison of the running and cycling tests revealed that HRmax was 6 bpm (P < 0.001) higher after treadmill testing, in spite of the fact that these clients were on the average 4 years younger (P < 0.05). The runners’ LT1 and LT2 were significantly higher, both when expressed in absolute HR values and in relative work rates: 14 bpm or 5% for LT1 (both P < 0.0001), and 11 bpm (P < 0.0001) or 3% (P < 0.001) for LT2.
Subgroup analysis on the basis of gender showed that the male cyclists were 3 years older (P = NS) and reached a slightly higher HRmax (2 bpm, P = NS). HR at the thresholds was also very similar in both sexes (P = NS), but based on the percentages relative to maximal power or speed the men appeared to be better trained than the women (respectively 73 vs. 70% for LT1 (P < 0.001), and 85 vs. 83% for LT2 (P < 0.01)). At peak exercise, the average man was able to push almost 100 Watt more (P < 0.0001).
To investigate the differences according to training status, we identified the 20 men with the lowest LT1 and the 20 ones with the highest LT1. The latter were 3 years younger (P = NS), achieved a slightly lower HRmax (P = NS) but a maximal power of exactly 80 Watt more (P < 0.0001).
Table 2. Comparison of heart rates, based on existing training guidelines.

Abbreviations & legend to the table: see Table 1.

Abbreviations & legend to the table: see Table 1.
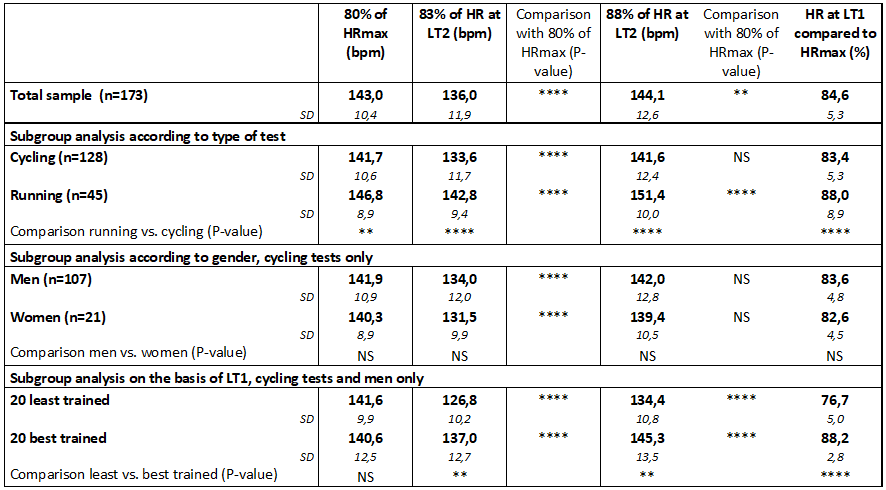
Table 2 shows additional analyses of the HR data, based on different guidelines to provide training advice, using either maximal or submaximal HR as an anchor point.
Considering the whole sample, 80% of HRmax yielded higher HRs than 83% of the HR at LT2, as proposed by Coggan (P < 0.0001), and slightly but significantly lower HRs than 88% of HR at LT2, as adopted by Suunto (P < 0.01).
When comparing subgroups, 80% of HRmax differed between cycling and running tests, but there was no significant effect of gender nor training status. Using HR at LT2 as an anchor point resulted in substantial and significant differences between cycling and running and between well- and less-trained subjects, but not between men and women.
Coggan’s method consistently yielded lower values than 80% of HRmax (P < 0.0001), but the absolute difference between both methods appeared to be smaller in case of running and in well-trained cyclists.
Suunto’s guideline was comparable (P = NS) with 80% of HRmax when considering the cycling tests of the whole sample, but yielded higher HRs (P < 0.0001) in case of treadmill testing. No differences between men and women were observed. As compared with 80% of HRmax, Suunto’s method resulted in lower HRs in deconditioned cyclists, but higher HRs in the well-trained.
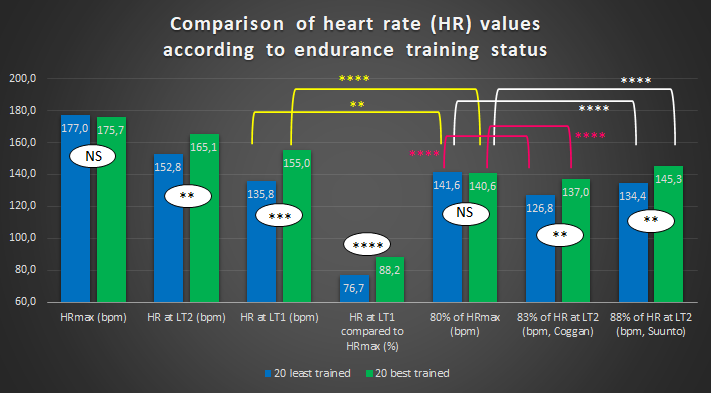
Figure 1 shows that 80% of HRmax was lower than HR at LT1 in well-trained cyclists (P < 0.0001), but higher in the least trained subjects (P < 0.01). In the latter group, HR at LT1 corresponded with 77% of HRmax, but with 88% in the fitter men.
Figure 1.

Abbreviations & legend to the figure: HR, heart rate; LT, lactate threshold;
NS, not significant; **P < 0.01, *** P < 0.001, ****P < 0.0001.
NS, not significant; **P < 0.01, *** P < 0.001, ****P < 0.0001.
Discussion
A variety of guidelines for the training of BE continue to circulate. Although it sounds attractive to give advice based on training status, some practical problems may arise. Indeed, delineating training zones based on LT1 and/or LT2 has the theoretical advantage that it fully accounts for the extent to which someone’s metabolism is developed (Iannetta et al 2020). However, and although it depends on the definition and the identification of the thresholds (Faude et al 2009), they may be too high for the well-trained and too low for the unfit subjects: this may result in too intensive training sessions on a too frequent basis for the former, and in almost no training at all for the latter (especially for weight-bearing activities such as running).Using HRmax as an anchor point is ‘personalized’ to a lesser extent (not accounting for training status, since HRmax is only rarely affected by training), but it has the practical advantages that the previous method does not have. The present study at least suggests that 80% of HRmax strikes the right balance for the general population. This measure allows the less fit to train a little bit more intensive, and prevents the well-trained to over-train. Moreover, from a metabolic viewpoint, 80% of HRmax will address fat combustion sufficiently, i.e. allowing for effective training of BE, irrespective of training status: 80% of HRmax will be higher than HR at LT1 in untrained subjects, but will be lower in the advanced. In addition, HR at LT1 corresponded tot 77 and 86% of HRmax in the least and the best trained, respectively. In an often-cited study, Achten et al (2002) found that fat oxidation was maximal (FATmax) between 68 and 79% of HRmax in 18 moderately trained male cyclists. This publication alone suggests that staying below 80% of HRmax will do for BE training.
The present data also show that both lactate thresholds come closer to each other with increasing training status: LT1 and LT2 were only 29 Watt (9%) or 10 bpm separated from each other in the fittest subjects. Hence, the difference between producing no lactate at all and a lot of lactate is very small in well-trained men, and this is an additional reason to be careful with training at intensities close to LT1, apart from the fact that systematic training at such relatively high workloads (LT1 = 252 Watt when maximal power = 314 Watt) costs a lot of energy.
Questions may arise regarding the use of the aerobic threshold (LT1) as a criterion to differentiate between the fit and the less fit. The anaerobic threshold (LT2) is a concept that has been the object of much more studies and therefore usually has been the obvious measure for training status. However, LT1 may be more sensitive to training than LT2, which has been observed to be more robust (Pardaens 2020). In addition, the premise of a ‘valid’ method to determine thresholds is that it corresponds with endurance performance or training status (Faude et al 2009). Hence, it should not make any difference if either LT1 or LT2 were used as a criterion to identify subgroups according to training status. Additional statistical analyses confirmed this: with LT2 instead of LT1 as the criterion to compare the least from the best trained, almost identical results were obtained (data not shown).
In the present study, women appeared to be less trained: their LTs tended to be lower than those of the men. Likewise, and in spite of their slightly younger age, HRmax of the women were on the average a few bpm lower at the end of the cycling test. This observation may be attributed to less muscle strength, which can be explained by gender per se, but by less training as well.
The well-known (cfr. early studies in the previous century) differences between cycling and running were confirmed by the present data: HRmax was higher after running than cycling. Moreover, when accounting for age, we even observed a difference of exactly 10 bpm. Thus, the rule of thumb to ‘translate’ training zones from cycling to running (or vice versa) by adding (or subtracting) 10 bpm can be maintained. In Interestingly, both LT1 and LT2 were substantially higher in running than in cycling, which is in line with the study of Capostagno & Bosch (2010), who observed a higher fat oxidation in running.
Conclusions and practical implications
When it comes to BE training, the present study lends support to the notion that ‘less might be more’. 80% of HRmax appears to be a reasonable upper limit for every population, irrespective of training status, to address and improve fat oxidation. If someone is not able to control HR below 80% of HRmax (eg. during running), this probably implies that other sports (eg. cycling or other non-weight bearing activities) may be more effective to enhance BE.Many endurance coaches will agree that systematic training at too high intensities is training mistake number one. A lot of research, published since the seminal work of Seiler & Kjerland (2006), regarding polarized training corroborate these coaches’ observations. The paradox of endurance training is that you become faster by training slowly. Training at a relatively low intensity, i.e. < 80% of HRmax, will increase ‘basic speed’. By definition, this is the speed you are able to sustain for a long duration, i.e. by means of fat rather than carbohydrates, of which we only have a limited reserve in our body. Thus, training relatively slowly will improve fat oxidation and therefore is decisive for the speed you can develop over more or less extended periods of time.
References
Achten J, Gleeson M, Jeukendrup AE. Determination of the exercise intensity that elicits maximal fat oxidation. Med Sci Sports Exerc. 2002;34:92-97.Bonaventura JM, Sharpe K, Knight E, Fuller KL, Tanner RK, Gore CJ. Reliability and accuracy of six hand-held blood lactate analysers. J Sports Sci Med. 2015;14:203-214.
Buckley J, Bourdon P, Woolford S. Effect of measuring blood lactate concentrations using different automated lactate analysers on blood lactate transition thresholds. J Sci Med Sport. 2003;6:408-421.
Capostagno B, Bosch A. Higher fat oxidation in running than cycling at the same exercise intensities. Int J Sport Nutr Exerc Metab. 2010 Feb;20:44-55.
Faude O, Kindermann W, Meyer T. Lactate threshold concepts: how valid are they? Sports Med. 2009;39(6):469-490.
Goodwin ML, Harris JE, Hernandez A, Gladden LB. Blood lactate measurements and analysis during exercise: a guide for clinicians. J Diabetes Sci Technol. 2007;1(4):558-569.
Iannetta D, Inglis EC, Mattu AT, Fontana FY, Pogliaghi S, Keir DA, Murias JM. A critical evaluation of current methods for exercise presciption in women and men. Med Sci Sports Exerc. 2020;52:466-473.
Pardaens K. Lactate testing: a practical and evidence-based guide. 2020 (syllabus for workshops, 80p).
Seiler KS and Kjerland G. Quantifying training intensity distribution in elite endurance athletes: is there evidence for an "optimal" distribution? Scand J Med Sci Sports 2006;16:49-56.

